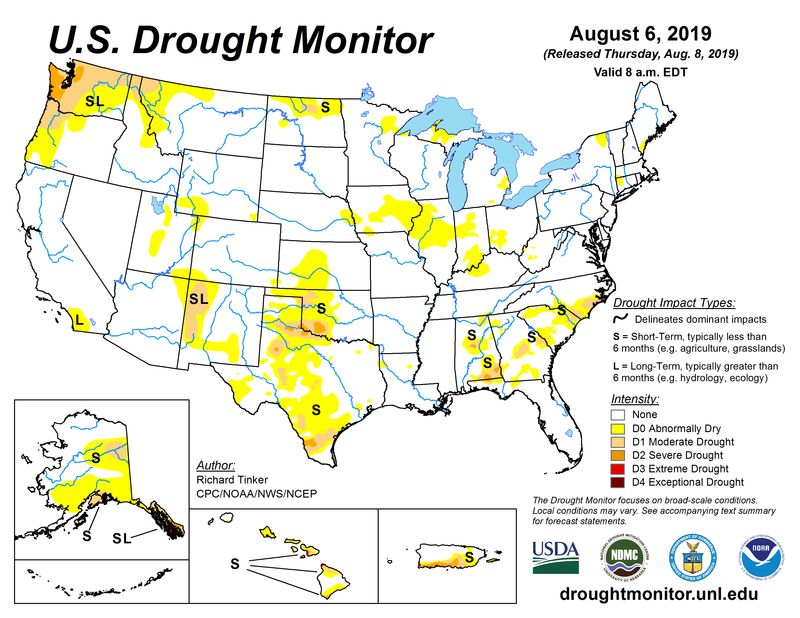
Assessments of short-term drought conditions in Utah showed recent improvements due to new precipitation, according to a July 16, 2026, report from the U.S. Drought Monitor, even as extreme drought continues to expand in neighboring Colorado.
Localized Improvements in Utah
The U.S. Drought Monitor, a collaborative effort involving the National Drought Mitigation Center (NDMC), the USDA, NOAA, and NASA, released its latest weekly summary on July 16. The report noted that an assessment of shorter-term conditions in Utah, alongside portions of western Oklahoma and parts of Texas, led to localized improvements in drought intensity.
These improvements are categorized under short-term impacts, which typically affect agriculture and grasslands for periods of less and less than six months. While the recent assessment provided some relief to Utah's short-term outlook, the broader Western United States continues to face significant hydrological challenges.
Worsening Conditions Nearby
Despite the relief noted for Utah's short-term metrics, drought conditions remain severe in adjacent regions. The July 16 report highlighted that drier areas in central Colorado experienced an expansion of both extreme and exceptional drought during the week.
In the Pacific Northwest, abysmal streamflow and deficits in short-term precipitation continued to impact parts of Washington, resulting in widespread degradation of drought conditions there. This highlights a stark contrast between the localized improvements seen in Utah and the worsening situation in neighboring states.
Understanding Drought Categories
The U.S. Drought Monitor utilizes a five-category system to track the intensity and location of drought across the country. The scale ranges from D0, which represents Abnormally Dry conditions—a precursor to drought rather than actual drought—to D4, representing Exceptional Drought.
Other categories include D1 (Moderate Drought), D2 (Severe Drought), and D1 (Extreme Drought). These assessments are based on a variety of indicators, including how much water is available in streams, lakes, and soils compared to the usual levels for that specific time of year.
Monitoring Methodology and Indicators
To create these weekly maps, authors from the participating agencies consider how recent precipitation totals compare to long-term averages. The process involves checking multiple variables such as temperature anomalies, soil moisture levels, snow cover, and meltwater runoff.
Beyond physical measurements, the monitoring process incorporates input from local observers to determine if drought is causing tangible impacts, such as water shortages or business interruptions. This multifaceted approach allows experts to make informed judgments on regional-scale conditions.
Agricultural and Community Impacts
The impacts of these drought levels extend significantly into the agricultural and hydrological sectors. According to data from drought.gov, agricultural drought specifically focuses on examining levels of precipitation, evaporative demand, soil moisture, and both surface and groundwater quantity and quality.
Drought can reduce the water availability and water quality necessary for productive farms, ranches, and grazing lands, often resulting in significant direct and indirect economic impacts to the agricultural sector. Furthermore, periods of drought can lead to inadequate water supplies, threatening the health, safety, and welfare of various communities.
The Role of Monitoring
The U.S. Drought Monitor began its record in 2000 and remains a primary tool for tracking land-based station data across the United States and Puerto Rico. The National Drought Mitigation Center, based at the University of Nebraska, Lincoln, leads the coordination of the weekly monitoring process and provides the resulting maps and statistics to the public.